The Dashboard Is Not the Work
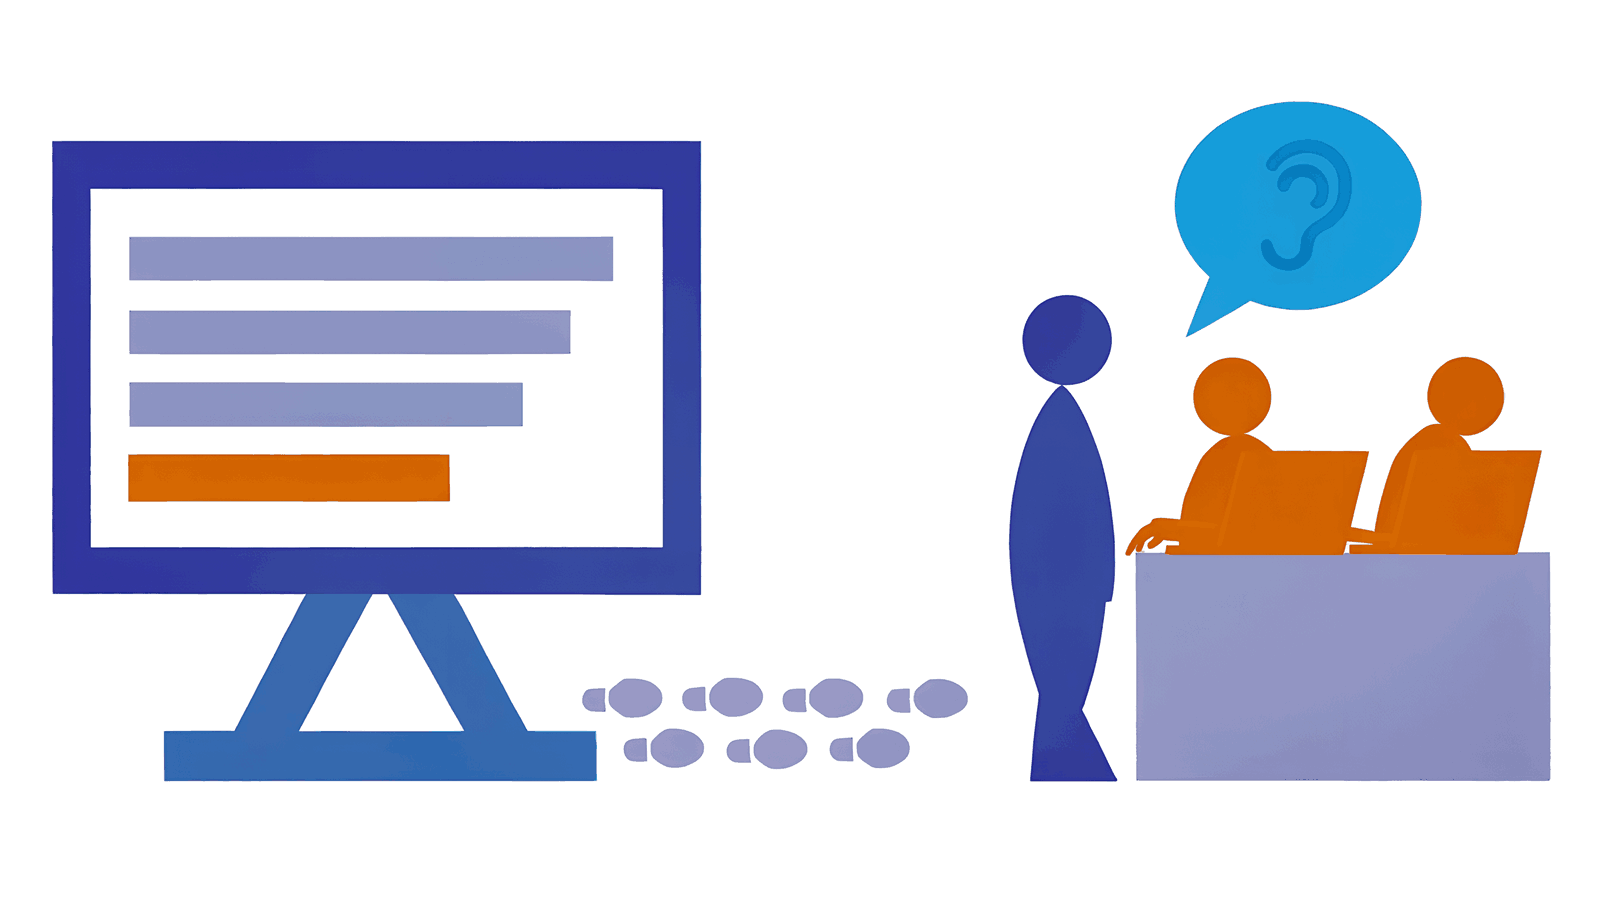
Agent telemetry tempts management to lead by numbers. The data belongs to the people who do the work, and leaders who want to understand the work have to go and see
A ranking that is precise and upside down
An HR director is shown a new dashboard by the vendor of the company’s AI coding assistant. For every developer it lists suggestions accepted, pull requests merged and tokens consumed, and ranks everyone in a single table. The developer at the top merged twice as many changes as last year. The developer near the bottom merged very little, because she spent most of the quarter reviewing other people’s AI-generated changes and finding the defects in them. The ranking is precise, it is fresh every morning, and it is upside down.
Consider rating the players of a football team by the number of goals each one scores. The striker tops the table every week; the defender who stops twenty attacks and the midfielder who makes the passes sit near the bottom. Pay the players by that table and, within a season, everybody shoots and nobody defends. No good coach picks the team from that table. A good coach watches the matches, and the training sessions too.
Agent telemetry is the most tempting dashboard ever offered to management: complete, updated every morning and apparently objective. The temptation is to manage by it, and that is the mistake. It is an old mistake, now cheaper to make and more convincing. Data about the work belongs to the people who do it, team or individual: a mirror for them to look into. Leaders who want to understand how the organisation works have a better instrument, and it is not new either: they go and see. That is a management responsibility, and no dashboard can carry it for them.
Agents make activity cheap
One vendor’s telemetry shows how far the numbers can drift from the work. Faros AI analysed usage data drawn from more than 22,000 developers and found 21 per cent more tasks completed per developer and 98 per cent more pull requests merged per developer, but also 54 per cent more bugs per developer, 242 per cent more incidents per pull request and median pull-request review time up 441 per cent (Faros AI, 2026).
The quality cost lands on someone else’s desk. A study of 22,953 pull requests from 1,719 developers found that less experienced contributors shifted the verification burden onto reviewers: 4.52 times more review comments, pull requests open 5.16 times longer and 31 per cent lower acceptance rates (Asdaque et al., 2026). Count activity and you reward the person who creates this load and penalise the reviewer who absorbs it. Every number on the opening dashboard is true. The picture they form is false.
Management by numbers, now with agents
None of this is new. Decades of quality management have warned against running an organisation on numerical targets. Deming’s fourteen points for management ask leaders to eliminate management by objective and management by numbers, and to put leadership in their place (Deming, 1986). The anthropologist Marilyn Strathern gave the problem its best-known form: when a measure becomes a target, it ceases to be a good measure (Strathern, 1997). People are not stupid. Show them which number counts and they will produce it.
Agents make this worse in a specific way: activity has become almost free to produce. A developer can raise the count of accepted suggestions, split work into smaller pull requests or generate more code in an afternoon than they could review in a week. Every one of those moves improves the dashboard and none of them improves the product. The review work that keeps quality up never appears there, so it is the first thing people stop doing.
Moving the dashboard from the person to the team does not solve this: a team ranked on incidents learns to classify them differently. Once a number travels upwards to be compared, it stops describing the work and starts directing it.
There is a human cost as well. Work with agents depends on people saying ‘I think the agent got this wrong’. What makes that sentence possible is psychological safety, ’the shared belief that the team is safe for interpersonal risk-taking’ (Edmondson, 1999). An organisation that uses AI to monitor performance and flag underperformers changes the relationship the work depends on: the person who was being led becomes a data source being analysed. Nobody admits a mistake to a data pipeline.
A mirror, not a scoreboard
None of this makes the data useless. In the hands of the people who produce it, it is valuable. A developer who notices that they accept nine out of ten suggestions can ask whether they are still reading the code. A team that sees its review queue growing week after week can discuss why in its retrospective, and decide to rotate who reviews AI-heavy changes or to keep pull requests small enough to review properly (Pugliese & Zanotto, 2026). The measures that tend to help are about the system rather than its members: review time, defect and incident rates, the load on reviewers and the flow of work.
What makes the difference is ownership. The team, or the individual, chooses what to look at, interprets it with the context only they have, and decides what to change. The data stays with them. It is not reported upwards and it is not used to compare anyone. Used this way, measurement supports learning rather than control, and it serves the principle ‘Effectiveness Is Measured by Outcomes, Not Activity’, one of the twelve principles of adaptive organisations described in the Society’s book Adaptive Organisations: Thriving in Complexity (Society for Adaptive Organisations, 2026).
Go and see
How, then, does management find out how the work is going? Toyota answered that question long before AI. In the Toyota Production System, leaders go to the gemba, the real place where the work happens, and look for themselves (Ohno, 1988). It is a discipline built on the conviction that ’no report, no dashboard and no second-hand account can substitute for seeing the work with your own eyes’ (Society for Adaptive Organisations, 2026).
What that looks like depends on the work, but the pattern holds everywhere: go where the work happens, watch it being done and ask the people who do it. In a team that works with coding agents, it means sitting next to a developer while they review an agent’s pull request and watching where they hesitate. In a contact centre, it means listening to calls beside an adviser while the AI assistant suggests replies, and noticing which suggestions they ignore and why. On a hospital ward, it means joining the shift handover and asking the nurses what the AI-generated patient summary left out. In a sales team, it means sitting in on a customer call and seeing what the system’s ’next best action’ missed about this customer. In a warehouse, it means walking the picking route the system planned, with the person who walks it every day.
The questions matter as much as the place. Ask what the tool got wrong this week and what happened next, what the numbers do not show about the work, and what the people doing it would change if they could. Then listen, without an agenda and without a slide. Go regularly, whether or not something has gone wrong: people are more open with leaders they see often, and the visit itself tells them that their work matters.
AI adds a trap of its own. An AI-generated summary of the organisation’s data feels closer to reality than a management report, because it is fluent and the data behind it is real. It is still a compression. It looks like going to see, but it works like every other abstraction: it filters and distorts what reaches the leader (Society for Adaptive Organisations, 2026). A leader who replaces the dashboard with a smarter dashboard has not gone anywhere.
That is why going to see cannot be delegated. It is part of what a manager is for, alongside creating the conditions in which people can do good work, and it is the main way a leader learns which of those conditions are missing. The Society describes the wider role in What is adaptive leadership.
The legal line
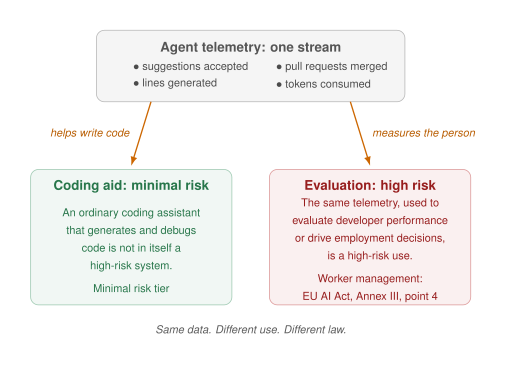
In the European Union there is one more reason to keep the data with the people who do the work. The AI Act classifies systems by their use. A coding assistant used to write and debug code is not in itself high-risk, but the same telemetry becomes high-risk the moment it is used to evaluate people’s performance or inform employment decisions, because worker management is listed in Annex III, point 4 (European Union, 2024). The deadlines for these obligations have changed, so ask your legal and data-protection teams for the current position before anyone points agent data at people.
Ask how you know
Now turn the question on your own organisation. Which numbers about people’s work with AI tools reach management today, and which decisions are made with them? Who decided that those numbers should travel upwards, and did anyone ask the people they describe? If the dashboard disappeared tomorrow, how would you find out how the work is going, and what does that tell you about how you know it today? When did you last sit with a team while it worked with its agents, without an agenda and without a slide? When someone says ’the agent got this wrong, and I accepted it’, what happens next: a conversation about the workflow, or a note in their file?
The day you stop looking at the dashboard
The vendor will be happy to show you what every person did with their agent today. The data is real, and it is the least informative view of the work you can get: it records what is easy to count and misses what the work depends on. Give it back to the people who produce it, so they can learn from it. Then go and see.
Chapter 8 of Adaptive Organisations: Thriving in Complexity, ‘Adaptive Leadership’, sets out the go-and-see discipline and explains why governing by abstraction is the most dangerous failure in leadership.
The question for management is not what the numbers say. It is a simpler one: when did you last see the work for yourself?
Sources
- Asdaque, S. A., Haider, I., Malik, M. U., Ghafoor, M. A., & Bangash, A. A. (2026). Novice developers produce larger review overhead for project maintainers while vibe coding. arXiv:2602.23905.
- Deming, W. E. (1986). Out of the crisis. MIT Center for Advanced Engineering Study.
- Edmondson, A. C. (1999). Psychological safety and learning behavior in work teams. Administrative Science Quarterly, 44(2), 350-383. https://doi.org/10.2307/2666999
- European Union. (2024). Regulation (EU) 2024/1689 of the European Parliament and of the Council of 13 June 2024 laying down harmonised rules on artificial intelligence (Artificial Intelligence Act). Official Journal of the European Union. http://data.europa.eu/eli/reg/2024/1689/oj
- Faros AI. (2026). Key takeaways from the DORA Report 2025 and the Acceleration Whiplash analysis. Faros AI.
- Ohno, T. (1988). Toyota production system: Beyond large-scale production. Productivity Press.
- Pugliese, P., & Zanotto, D. (2026). Agentic coding teams: What the evidence says about teams of humans working with AI agents. Connexxo GmbH. https://connexxo.com/resources/agentic-coding-teams/
- Society for Adaptive Organisations. (2026). Adaptive organisations: Thriving in complexity. https://leanpub.com/adaptiveorganisations
- Strathern, M. (1997). ‘Improving ratings’: Audit in the British university system. European Review, 5(3), 305-321.